Every 60 seconds online, billions of actions unfold: YouTube videos streamed, emails sent, TikToks uploaded, and dollars spent shopping.
The “Internet Minute” captures the sheer scale of digital life; and in 2025, the numbers are bigger than ever.
As of 2025, the digital universe is more vibrant than ever. Approximately 5.56 billion people worldwide are connected to the internet, equating to about 67.9% of the global population. These users are not just browsing; they are engaging with content, making purchases, and interacting on social media, with 5.24 billion active users worldwide (DataReportal, 2025).
Internet Minute 2025: Key Highlights
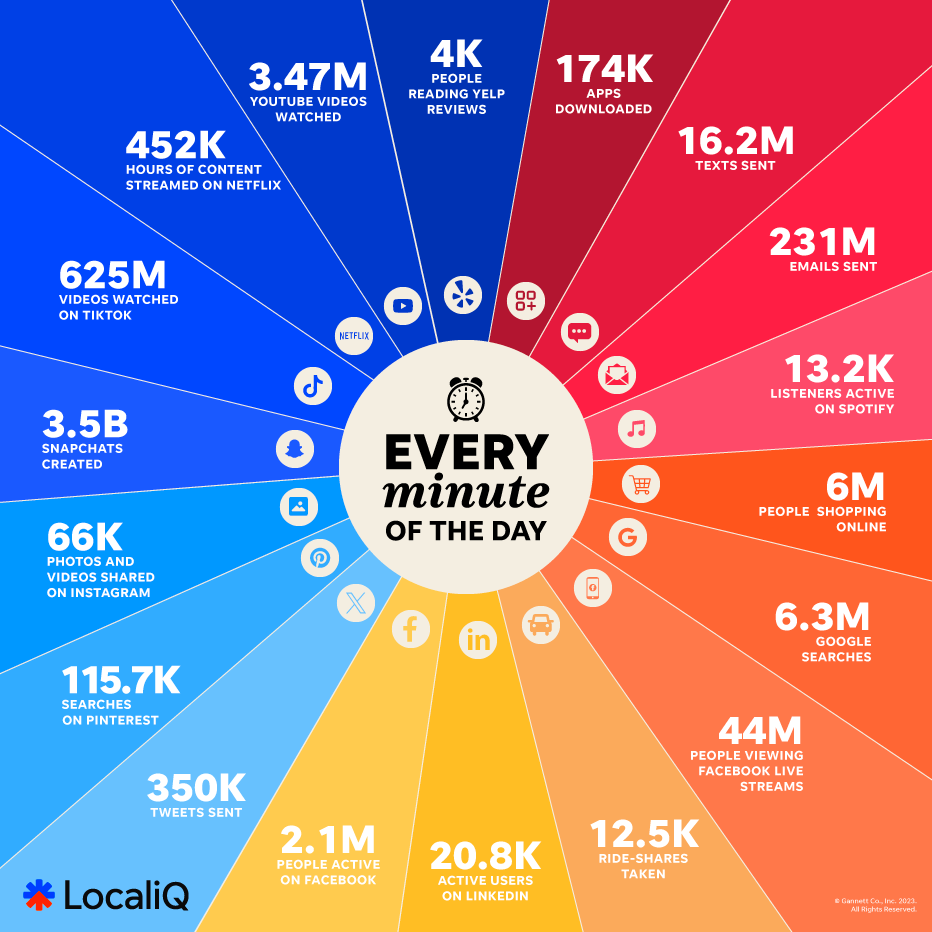
In just one minute online in 2025:
- 694M Spotify songs streamed
- 231M emails sent
- 6.3M Google searches conducted
- 3.47M YouTube videos watched
- 625M TikTok videos watched
- $43.6M spent online during peak shopping times
- 174K apps downloaded
- 66K Instagram photos shared
- 2.1M active Facebook users
Internet Minute: 2015–2025 Decade Comparison
Over the past decade, Internet activity has grown at an unprecedented pace. From 2015 to 2025, global digital behaviours transformed dramatically, driven by social media, streaming services, mobile apps, and IoT devices.
From 204 million emails in 2015 to 625 million TikToks watched in 2025. Here’s what happens every minute on the internet across the last ten years.
| Year | Emails Sent | Google Searches | YouTube Views | TikTok Views | Online Spend | App Downloads | Instagram Activity |
|---|---|---|---|---|---|---|---|
| 2025 | 231M+ | 6.3M+ | 3.47M | 625M videos watched | $43.6M+ | 174K | 66K photos shared |
| 2024 | 231M | 6.3M | 3.47M | 625M videos watched | $43.6M (peak minute) | 174K | 66K photos shared |
| 2023 | 231M | 5.9M | 3.67M | 167M videos watched | $1.5M+ (est.) | 174K | 694M songs streamed |
| 2022 | 231M | 5.9M | 508 hrs uploaded | 1B+ interactions | $443K (Amazon only) | 437K transfers | 527K photos shared |
| 2021 | 225M (est.) | 5.7M (est.) | 5.0M (est.) | 167M (est.) | $1.3M (est.) | 450K (est.) | 800K (est.) scrolling |
| 2020 | 190M | 4.1M | 4.7M | N/A | $1.1M | 400K | 694K scrolling |
| 2019 | 188M | 3.8M | 4.5M | N/A | $996K | 390K | 347K scrolling |
| 2018 | 187M | 3.7M | 4.3M | N/A | $862K | 375K | 174K scrolling |
| 2017 | 156M | 3.5M | 4.1M | N/A | $751K | 342K | 46K posts uploaded |
| 2016 | 150M | 2.4M | 2.78M | N/A | $203K | 51K | 527K photos shared |
| 2015 | 204M | 2M+ | 1.3M | N/A | $83K | 47K | 3,000 uploads |
Break it down:
- Emails plateaued at ~231M since 2022
- Streaming exploded (YouTube/TikTok dominance)
- Online spend grew 500x in 10 years
- App downloads and social media engagement surged
“In 2015, only 47K apps were downloaded per minute. By 2025, it’s 174K.”
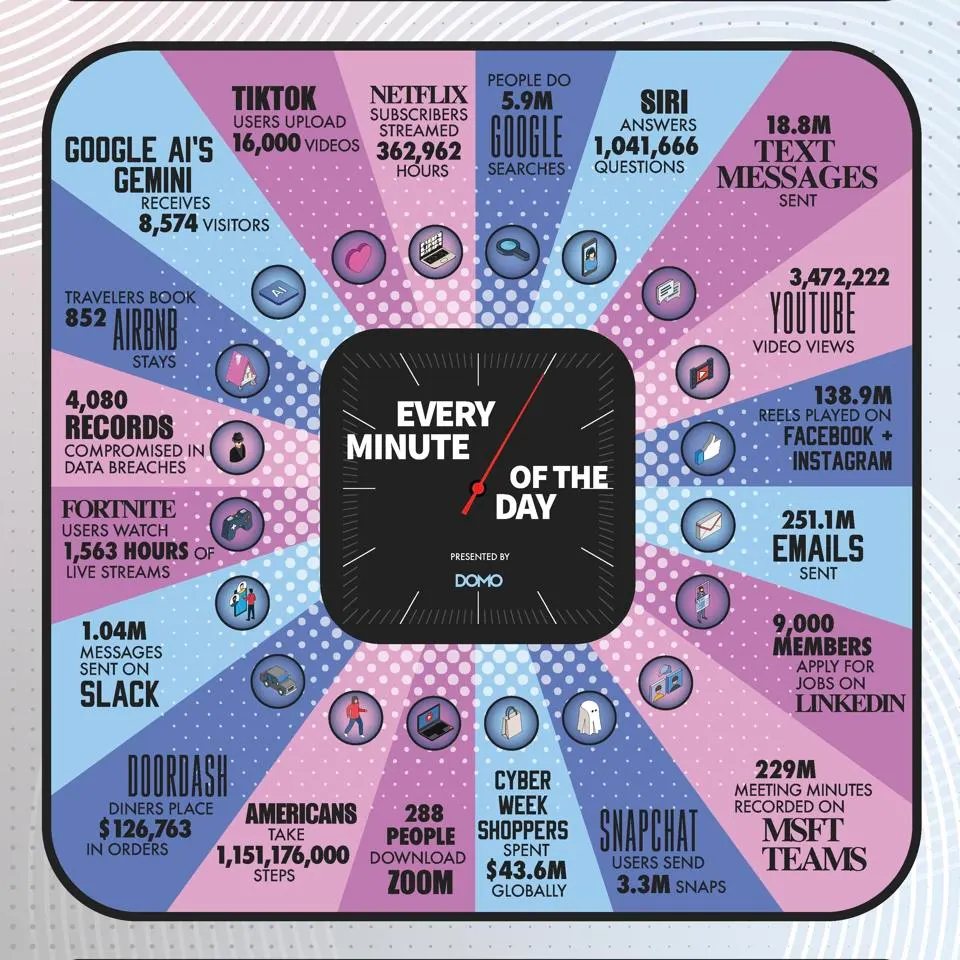
Internet Minute 2024
2024 marked another leap in digital engagement. $43.6M was spent online per minute during peak shopping events, and 3.47M YouTube videos were streamed every 60 seconds. TikTok continued its dominance with 625M video views per minute.
Internet Minute 2023
In 2023, people sent 231M emails per minute and streamed 694M songs on Spotify. TikTok saw 167M video views per minute, while Google processed 5.9M searches every 60 seconds.

Internet Minute 2022
2022 witnessed over 231M emails sent and 1M hours of video content streamed every minute. With $443K spent online per minute on Amazon alone, e-commerce continued its upward surge.

Internet Minute 2021
In 2021, internet activity surged as 225M emails were sent, 5.7M Google searches conducted, and 5M YouTube videos viewed per minute. App downloads and streaming also spiked, reflecting pandemic-era digital reliance.

Internet Minute 2020
The pandemic year of 2020 saw massive spikes in digital engagement. 1.1M dollars were spent online every minute, 4.1M Google searches occurred, and people streamed 694,444 hours of Netflix content every 60 seconds.

Internet Minute 2019
In 2019, users logged 3.8M Google searches, sent 188M emails, and viewed 4.5M YouTube videos every minute. With nearly $1M spent online per minute, e-commerce firmly established its global presence.

Internet Minute 2018
The Internet Minute in 2018 saw 187M emails sent and 4.3M YouTube videos watched per minute. Social media usage continued to grow, with 174K Instagram scrolls every 60 seconds.

Internet Minute 2017
2017 highlighted the rise of video streaming with 4.1M YouTube views per minute. Google processed 3.5M searches and users sent 156M emails every 60 seconds.

Internet Minute 2016
In 2016, people sent 150M emails and made 2.4M Google searches every minute. Snapchat and Instagram continued their upward climb in global engagement.

Internet Minute 2015
Back in 2015, the digital world was just starting to accelerate. Every minute, users sent 204M emails, conducted 2M+ Google searches, and spent $83K online.

Understanding the Forces Driving Changes in Internet Usage
In a nutshell, every year more and more people will join the race of internet, there are still parts of the web that are plateauing or even shrinking in size.
Several factors influence these dramatic increases in activities:
- Economic Factors: As global economies evolve, so does the digital marketplace, influencing how consumers and businesses interact online.
- Technological Advancements: Innovations like 5G and improved AI have made online activities faster and more engaging.
- Social Shifts: Global events often drive people online for information, shopping, and staying connected.
You’ll see that social media keeps on growing and search engine keeps increasing only from last year. On top of that, the number of emails getting sent is also quite stagnant, likely thanks to the rise of workplace collaboration tools such as Slack.
Regardless, we’re certain that by this time next year, this will have changed significantly yet again!
Predictions for Future Internet Minute
Based on current trends, we anticipate the 2026 Internet Minute to involve even more interactivity, with advancements in virtual reality and augmented reality expected to become more mainstream. The proliferation of IoT devices is also likely to push data consumption to new heights.
The Internet Minute never stops growing. Bookmark this blog for yearly updates and stay ahead of digital trends.
Conclusion
From streaming videos to social media interactions and online purchases, the internet minute in 2025 demonstrates our deepening reliance on digital connectivity. These insights not only help businesses and marketers strategize but also allow individuals to understand their own digital footprint better.
If you liked this article, then please subscribe to our blog for more updates like this. You can also find us on Facebook, Instagram, Twitter, Pinterest, LinkedIn and YouTube.
Citations & References
We Are Social & DataReportal (2025)
Digital 2025 Global Overview Report – confirmed 5.56B internet users (67.9%), 5.24B social media accounts
LocaliQ Insights (2025)
What Happens in an Internet Minute – minute-by-minute usage stats for 2025
Forbes (Tim Bajarin, 2025)
Mind‑Blowing Stats of What Transpires on the Internet Every Minute – AI-driven trend references, based on Domo’s Data Never Sleeps report
Domo
Data Never Sleeps 12.0 / 2023–2025 – tracked growth in email, search, and app usage each minute
Statista / Cisco / Pew / Digital Information World
Suggested for confirming historical minute stats (2015–2020) if you’d like to add even more credibility.
